Using Data
Dependency
The BDD100K toolkit depends on Python 3.7+. To install the python dependencies:
pip3 install -r requirements.txt
Understanding the Data
You can start the Visualization by running:
python3 -m scalabel.vis.controller <args>
Available arguments:
--image-dir IMAGE_DIR, -i IMAGE_DIR
                        path to the image directory
--labels LABEL_PATH, -l LABEL_PATH
                        path to the json file
--color-dir COLORMAP_DIR, -c COLORMAP_DIR
                        path to the colormap directory
--scale SCALE, -s SCALE
                        visualization size scale
--height HEIGHT
                        height of the image(px)
--width WIDTH
                        width of the image(px)
--no-attr
                        do not show attributes
--no-box3d
                        do not show 3D bouding boxes
--no-tags
                        do not show tags on boxes or polygons
--no-vertices
                        do not show vertices
--output_dir OUTPUT_DIR, -o OUTPUT_DIR
                        output image directory with label visualization. If
                        it is set, the images will be written to the output
                        folder instead of being displayed interactively.
--nproc NUM_PROCESS
                        number of processes for json loading and parsing
In the visualization window, you may use these keys for controlling:
- n / p: Show next or previous image
- Space: Start / stop animation
- t: Toggle 2D / 3D bounding box (if avaliable)
- a: Toggle the display of the attribute tags on boxes or polygons.
- c: Toggle the display of polygon vertices.
- Up: Increase the size of polygon vertices.
- Down: Decrease the size of polygon vertices.
Trajectories
To visualize the GPS trajectories provided in bdd100k/info, you can run the
command below to produce an html file that displays a single trajectory and
output the results in folder out/:
python3 -m bdd100k.vis.trajectory \
    -i bdd100k/info/train/0000f77c-6257be58.json -o out/ -k {YOUR_API_KEY}
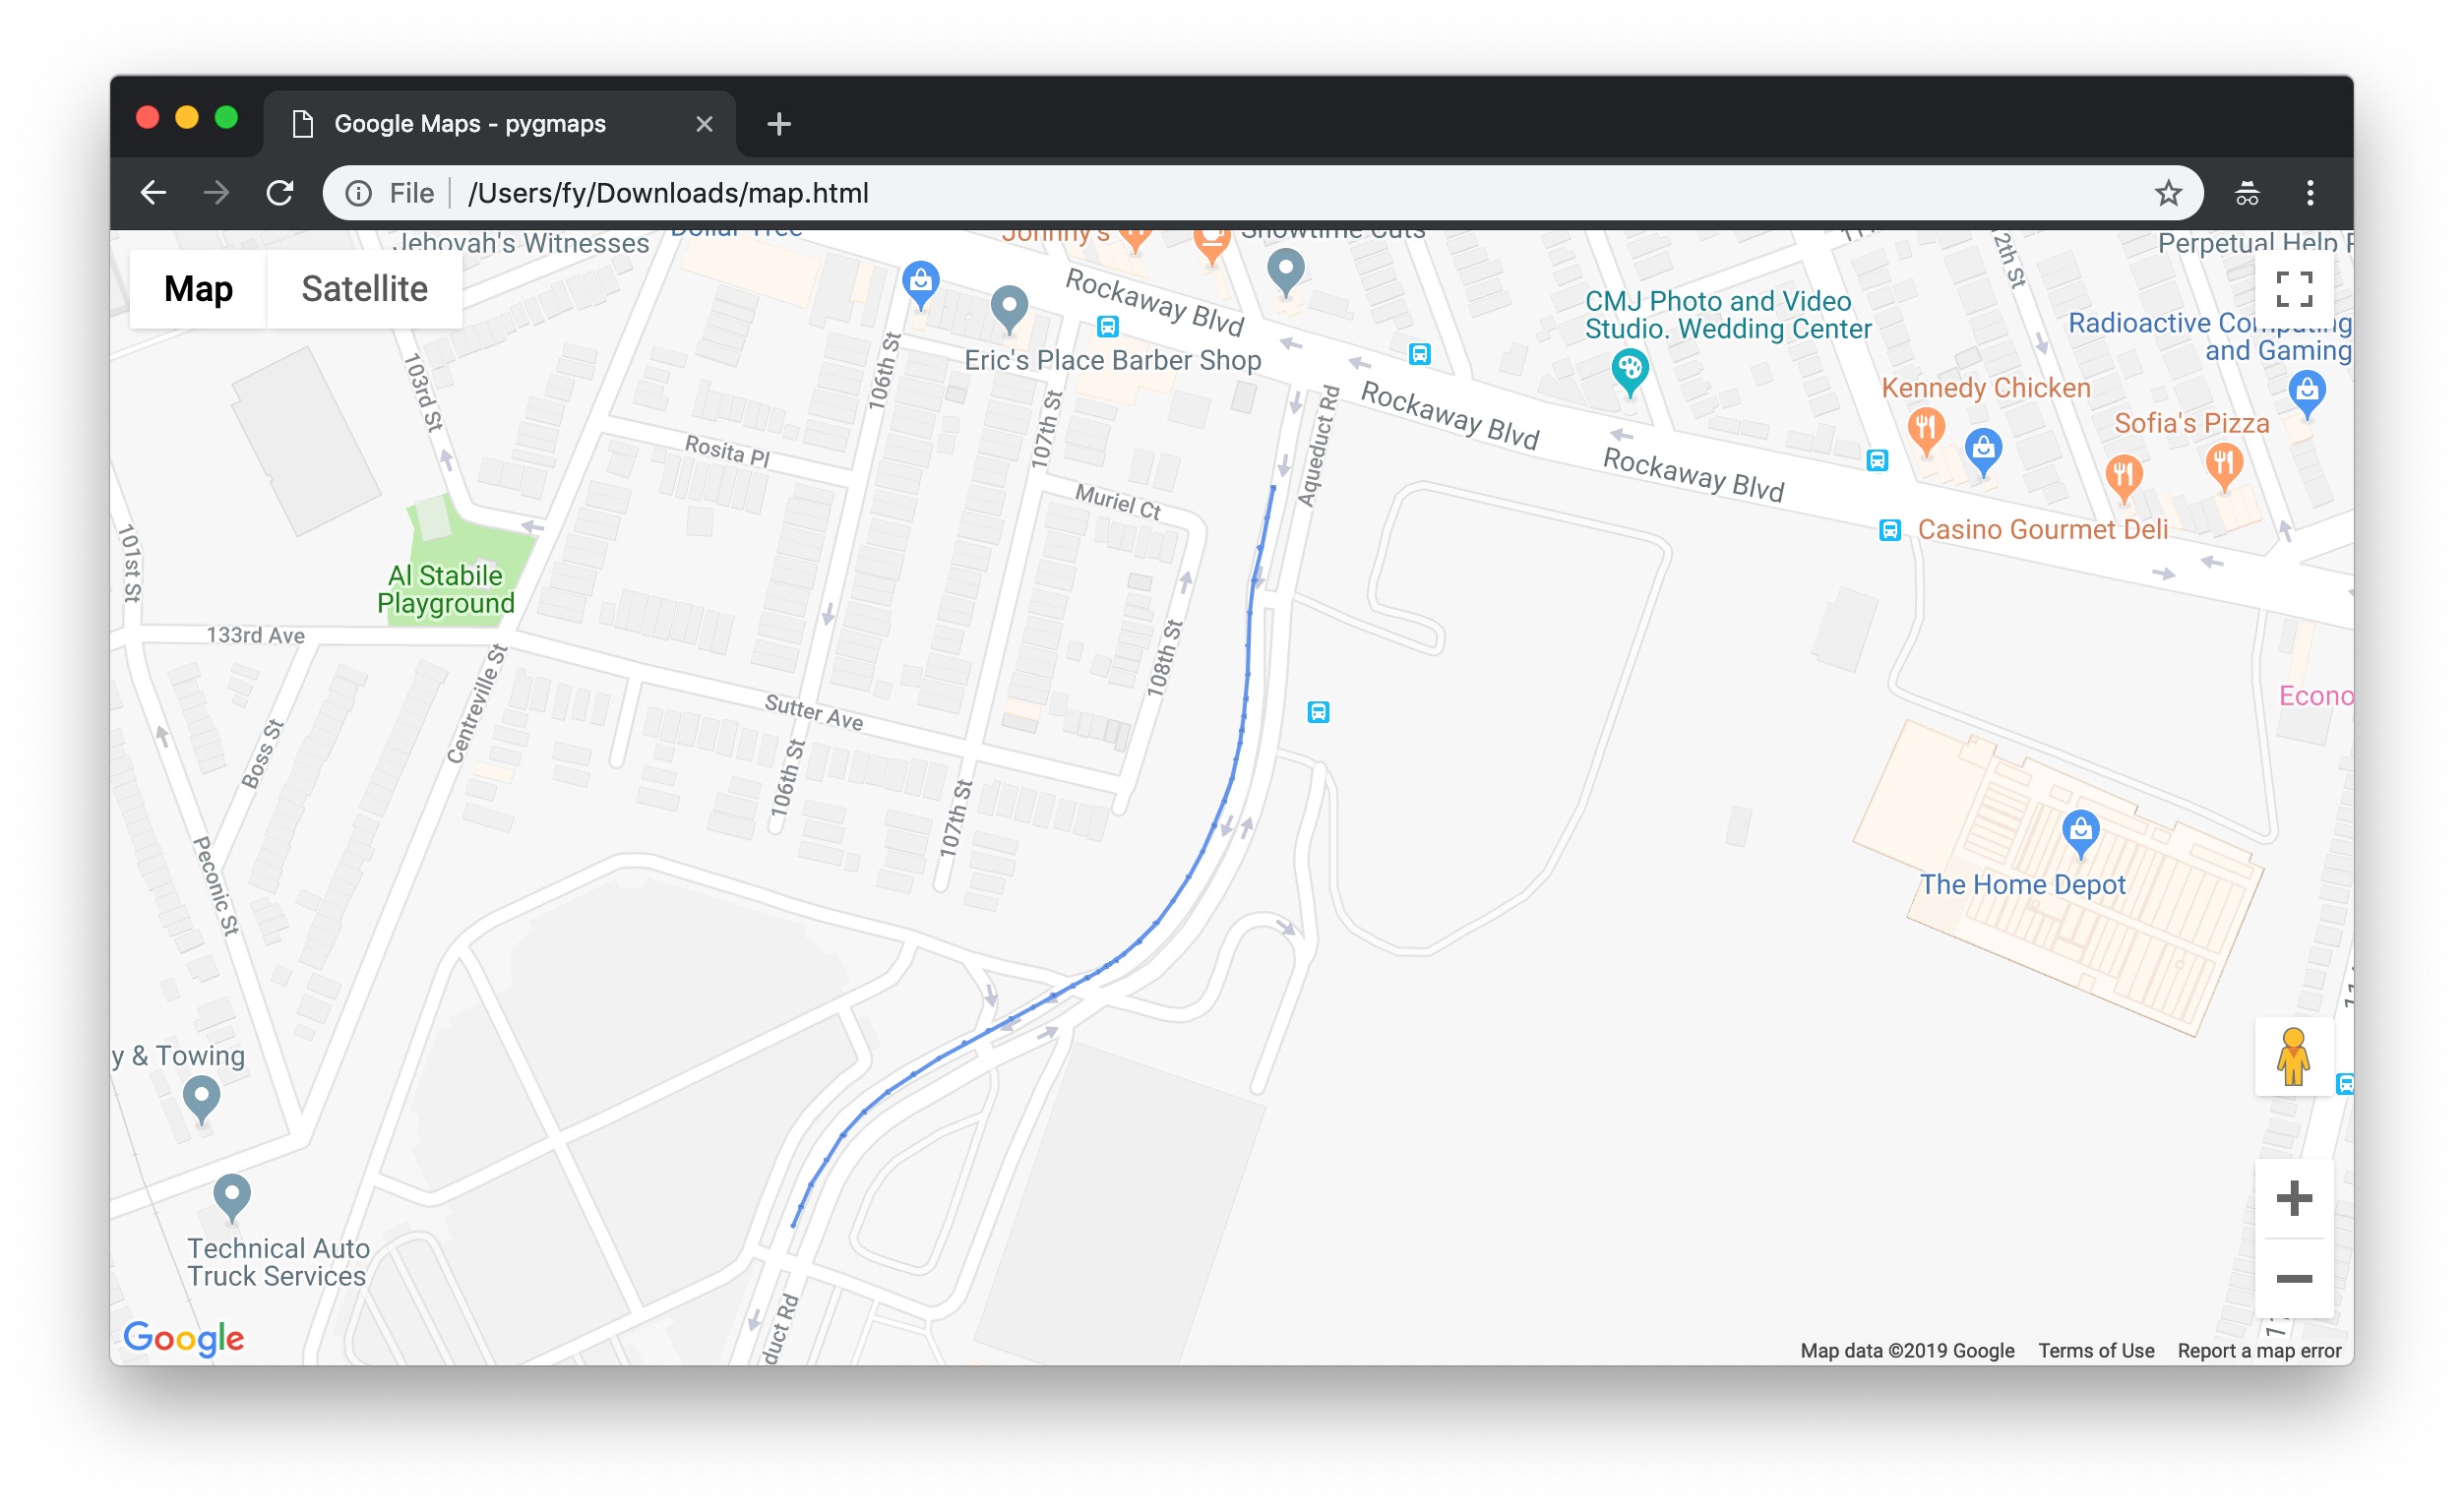
Or create html file for each GPS trajectory in a directory, for example:
python3 -m bdd100k.vis.trajectory \
    -i bdd100k/info/train -o out/ -k {YOUR_API_KEY}
To create a Google Map API key, please follow the instruction here. The generated maps will look like
Semantic Segmentation
At present time, instance segmentation is provided as semantic segmentation maps
and polygons in json will be provided in the future. The encoding of labels
should still be train_id defined in bdd100k.label.label,
thus car should be 13.